imbalanced-learnで不均衡なデータのunder-sampling/over-samplingを行う

今回は不均衡なクラス分類で便利なimbalanced-learnを使って、クレジットカードの不正利用を判定します。

データセット

今回はkaggleで提供されているCredit Card Fraud Detectionデータセットを使います。

ヨーロッパの人が持つカードで、2013年9月の2日間の取引を記録したデータセットです。
1取引1レコードとなっており、各レコードには不正利用か否かを表す値(1ならば不正利用)を持っていますが、当然ながらほとんどが0で、極めて不均衡なデータセットとなっています。 また、個人情報に関わるため、タイムスタンプと金額以外の項目が主成分分析(および標準化)済みとなっていることも特徴です。

# ライブラリのインポート
import pandas as pd
from sklearn.model_selection import train_test_split
from sklearn.metrics import confusion_matrix
from sklearn.ensemble import RandomForestClassifier

# CSVファイルをDataFrameへロード
original_df = pd.read_csv('creditcard.csv')

original_df.head()

f:id:ohke:20170812091618p:plain

不正利用かどうかは'Class'列に入っており、1ならば不正利用です。 Classが0のサンプル数が284,315に対して、1のサンプル数は492と、不均衡な分布です。

original_df['Class'].value_counts()
# 0    284315
# 1       492

前処理などを行わず(ただしタイムスタンプ(‘Time’)は特徴量から削除します)、この段階でランダムフォレスト(決定木は100個)で学習・テストさせます。

結果、テストデータのスコアは99.95%という高い値となりましたが、もともとかなり偏りがあって全て0と答えるだけでも99.82%が達成されることを鑑みると、決して良い結果ではありません。 混合行列を見ても、不正利用であると誤って判定(偽陽性、False Positive: FP)しているサンプル数が10に対して、不正利用ではないと誤って判定(偽陰性、False Negative: FN)しているサンプル数が66になっており、不正利用ではないと判定されやすくなっていることがわかります。

# 説明変数Xと目的変数yの抽出
X = original_df.loc[:, 'V1':'Amount']
y = original_df.loc[:, 'Class':]

# 学習データとテストデータの分離
X_train, X_test, y_train, y_test = train_test_split(X, y, test_size=0.5, random_state=0)

# ランダムフォレストによる学習
rfc = RandomForestClassifier(random_state=0, n_estimators=100)
rfc.fit(X_train, y_train)

# 検証
print('Train score: {:.4f}'.format(rfc.score(X_train, y_train)))
print('Test score: {:.4f}'.format(rfc.score(X_test, y_test)))
print('Confusion matrix:\n{}'.format(confusion_matrix(y_test, rfc.predict(X_test))))
print('f1 score: {:.4f}'.format(f1_score(y_test, rfc.predict(X_test))))
# Train score: 1.0000
# Test score: 0.9995
# Confusion matrix:
# [[142151     10]
#  [    66    177]]
# f1 score: 0.8233

imblanced-learn

偏りが大きいデータセットに対して、多少の偽陽性が増えたとしても、偽陰性を減らしたい場合があります。 ここでは、誤検出が少し増えても不正利用を検出したい、というニーズです。

そうした場合に、学習に使われる陽性サンプルの割合を増やすことで偽陰性を減らす、という方法がしばしば採られるようです(当然、偽陽性は増えてしまいます)。 割合を操作するには、大きく括ると3つのやり方があります。

  • 陰性サンプルを減らす(under-sampling)
  • 陽性サンプルを増やす(over-sampling)
  • 上記両方を行う

Pythonでは、imbalanced-learnを使うことで、こうしたサンプル数の操作を簡単にできます。

pip install -U imbalanced-learnでレポジトリからインストールできます。 しかし、PyPIで提供されているバージョンは0.2.1(2017/8/12現在)で、細かいパラメータ設定などができないため、開発バージョンを取得してインストールします。 やり方はここに記載のとおりです。

git clone https://github.com/scikit-learn-contrib/imbalanced-learn.git
cd imbalanced-learn
python setup.py install

under-sampling

まずは、under-samplingを行います。

imbalanced-learnで提供されているRandomUnderSamplerで、陰性サンプル(ここでは不正利用ではない多数派のサンプル)をランダムに減らし、陽性サンプル(不正利用である少数派のサンプル)の割合を10%まで上げます。

同じパラメータでランダムフォレストを使って学習・テストすると、FNが66から43まで減っていることがわかります。 一方でFPは10から157となっており、誤検出が大幅に増えています。

from imblearn.under_sampling import RandomUnderSampler

# 不正利用のサンプル数をカウント
positive_count_train = y_train['Class'].sum()
print('positive count: {}'.format(positive_count_train))
# positive count: 249

# ランダムにunder-sampling
rus = RandomUnderSampler(ratio={0:positive_count_train*9, 1:positive_count_train}, random_state=0)
X_train_resampled, y_train_resampled = rus.fit_sample(X_train, y_train)
print('X_train_resampled.shape: {}, y_train_resampled: {}'.format(X_train_resampled.shape, y_train_resampled.shape))
print('y_train_resample:\n{}'.format(pd.Series(y_train_resampled).value_counts()))
# X_train_resampled.shape: (2490, 29), y_train_resampled: (2490,)
# y_train_resample:
# 0    2241
# 1     249
# dtype: int64

# ランダムフォレストにて学習
rfc = RandomForestClassifier(random_state=0)
rfc.fit(X_train_resampled, y_train_resampled)

# 検証
print('Train score: {:.4f}'.format(rfc.score(X_train_resampled, y_train_resampled)))
print('Test score: {:.4f}'.format(rfc.score(X_test, y_test)))
print('Confusion matrix:\n{}'.format(confusion_matrix(y_test, rfc.predict(X_test))))
print('f1 score: {:.4f}'.format(f1_score(y_test, rfc.predict(X_test))))
# Train score: 0.9968
# Test score: 0.9986
# Confusion matrix:
# [[142004    157]
#  [    43    200]]
# f1 score: 0.6667

over-sampling

次にRandomOverSamplerを使って、over-samplingを行います。 under-samplingの場合とは逆で、陽性サンプルを増やすことで、不正利用の割合を10%にします。

ランダムフォレストで学習・テストさせると、FNは66から60まで減っていますが、under-samplingと比較すると効果は薄くなっています。 同じ不正利用のサンプルが増えるだけでは、学習モデルに与える影響は小さくとどまる傾向にあるようです。

from imblearn.over_sampling import RandomOverSampler

# ランダムにover-sampling
ros = RandomOverSampler(ratio={0: X_train.shape[0], 1: X_train.shape[0]//9}, random_state=0)
X_train_resampled, y_train_resampled = ros.fit_sample(X_train, y_train)
print('X_train_resampled.shape: {}, y_train_resampled: {}'.format(X_train_resampled.shape, y_train_resampled.shape))
print('y_train_resample:\n{}'.format(pd.Series(y_train_resampled).value_counts()))
# y_train_resample:
# 0    142403
# 1     15822
# dtype: int64

# ランダムフォレストにて学習
rfc = RandomForestClassifier(random_state=0)
rfc.fit(X_train_resampled, y_train_resampled)

# 検証
print('Train score: {:.4f}'.format(rfc.score(X_train_resampled, y_train_resampled)))
print('Test score: {:.4f}'.format(rfc.score(X_test, y_test)))
print('Confusion matrix:\n{}'.format(confusion_matrix(y_test, rfc.predict(X_test))))
print('f1 score: {:.4f}'.format(f1_score(y_test, rfc.predict(X_test))))
# Train score: 1.0000
# Test score: 0.9995
# Confusion matrix:
# [[142147     14]
#  [    60    183]]
# f1 score: 0.8318

under-samplingとover-sampling(SMOTE)の組み合わせ

最後に2つを組み合わせてみます。

imbalanced-learnではランダム以外にもいくつかover-samplingの実装が用意されており、その1つにSMOTE(Synthetic Minority Over-sampling Technique)があります。 SMOTEは、今あるサンプルをコピーするのではなく、異なる値を持つサンプルを新たに生成することで増やす方法です。 (陽性サンプル間を結ぶ直線上に新しいサンプルをプロットするイメージのようです。)

まずは、under-samplingで不正利用の割合を1%まで増やし、その後SMOTEで不正利用のサンプルを10倍にすることで不正利用の割合を約10%となるようにします。

学習・テストの結果、FNをRandomUnderSampler単体の場合と同じ43まで減らしている一方で、FPの増加は72まで抑えています。 under-samplingだけでは不正利用のサンプルに寄った過学習を起こしていましたが、SMOTEと組み合わせることで軽減できることを確認しました。

from imblearn.over_sampling import SMOTE

# under-samplingで不正利用の割合を1%まで増やす
positive_count_train = y_train['Class'].sum()
rus = RandomUnderSampler(ratio={0:positive_count_train*99, 1:positive_count_train}, random_state=0)
X_train_undersampled, y_train_undersampled = rus.fit_sample(X_train, y_train)
print('y_train_undersample:\n{}'.format(pd.Series(y_train_undersampled).value_counts()))
# y_train_undersample:
# 0    24651
# 1      249
# dtype: int64

# SMOTEで不正利用の割合を約10%まで増やす
smote = SMOTEENN(ratio={0:positive_count_train*99, 1:positive_count_train*10}, random_state=0)
X_train_resampled, y_train_resampled = smote.fit_sample(X_train_undersampled, y_train_undersampled)
print('y_train_resample:\n{}'.format(pd.Series(y_train_resampled).value_counts()))
# y_train_resample:
# 0    24651
# 1     2490
# dtype: int64

# 検証
rfc = RandomForestClassifier(random_state=0)
rfc.fit(X_train_resampled, y_train_resampled)
print('Train score: {:.4f}'.format(rfc.score(X_train_resampled, y_train_resampled)))
print('Test score: {:.4f}'.format(rfc.score(X_test, y_test)))
print('Confusion matrix:\n{}'.format(confusion_matrix(y_test, rfc.predict(X_test))))
print('f1 score: {:.4f}'.format(f1_score(y_test, rfc.predict(X_test))))
# Train score: 0.9996
# Test score: 0.9992
# Confusion matrix:
# [[142089     72]
#  [    43    200]]
# f1 score: 0.7767

scikit-learnで乳がんデータセットを主成分分析する

乳がんデータセットを主成分分析で次元圧縮してみます。

データセット

今回はUCIから提供されています乳がんデータセットを使います。 このデータセット乳がんの診断569ケースからなります。 各ケースは検査値を含む32の値を持っており、変数の多いデータセットです。 各ケースには診断結果(良性腫瘍 or 悪性腫瘍)が付いており、これを目的変数とする分類学習となります。

Breast Cancer Wisconsin (Diagnostic) Data Set | Kaggle

このデータセット(csvファイル)をダウンロードして、ロードします。

# ライブラリのインポート
import pandas as pd
import matplotlib.pyplot as plt
%matplotlib inline
import seaborn
from sklearn.preprocessing import StandardScaler
from sklearn.decomposition import PCA
from sklearn.pipeline import Pipeline
from sklearn.linear_model import LogisticRegressionCV
from sklearn.model_selection import train_test_split
from sklearn.metrics import confusion_matrix

# データセットのロード
original_df = pd.read_csv('Breast_Cancer_Wisconsin_(Diagnostic)_Data_Set.csv')
print('original_df shape: {}'.format(original_df.shape))
# original_df shape: (569, 33)

# ゴミデータの削除
original_df.drop('Unnamed: 32', axis=1, inplace=True)
original_df

左の列から、ID、診断結果(良性:B/悪性:M)、3列目以降は計測値等となっています。 したがって、この30列(3〜32列目)が説明変数となり

f:id:ohke:20170805090104p:plain

目的変数の分布を確認すると、良性:Bが357、悪性:Mが212で、悪性は全体の37%程度です。 目的変数と説明変数をそれぞれ抽出しておきます。

original_df.diagnosis.value_counts()
# B    357
# M    212
# Name: diagnosis, dtype: int64

# 目的変数の抽出
y = original_df.diagnosis.apply(lambda d: 1 if d == 'M' else 0)

# 説明変数の抽出
X = original_df.ix[:, 'radius_mean':]

ロジスティック回帰で学習・テスト

主成分分析で次元圧縮する前に、まずは30個の説明変数を使って、ロジスティック回帰で学習・テストさせて、基準となる精度を出しておきます。

学習データ・テストデータの分離、標準化、ロジスティック回帰(10分割交差検証)で学習・テストすると、精度97%となりました。

# 学習用とテスト用でデータを分離
X_train, X_test, y_train, y_test = train_test_split(X, y, random_state=0)

# 標準化
scaler = StandardScaler()
X_train_scaled = scaler.fit_transform(X_train)
X_test_scaled = scaler.transform(X_test)

# ロジスティック回帰で学習
logistic = LogisticRegressionCV(cv=10, random_state=0)
logistic.fit(X_train_scaled, y_train)

# 検証
print('Train score: {:.3f}'.format(logistic.score(X_train_scaled, y_train)))
print('Test score: {:.3f}'.format(logistic.score(X_test_scaled, y_test)))
print('Confustion matrix:\n{}'.format(confusion_matrix(y_true=y_test, y_pred=logistic.predict(X_test_scaled))))
# Train score: 0.988
# Test score: 0.972
# Confustion matrix:
# [[89  1]
#  [ 3 50]]

主成分分析

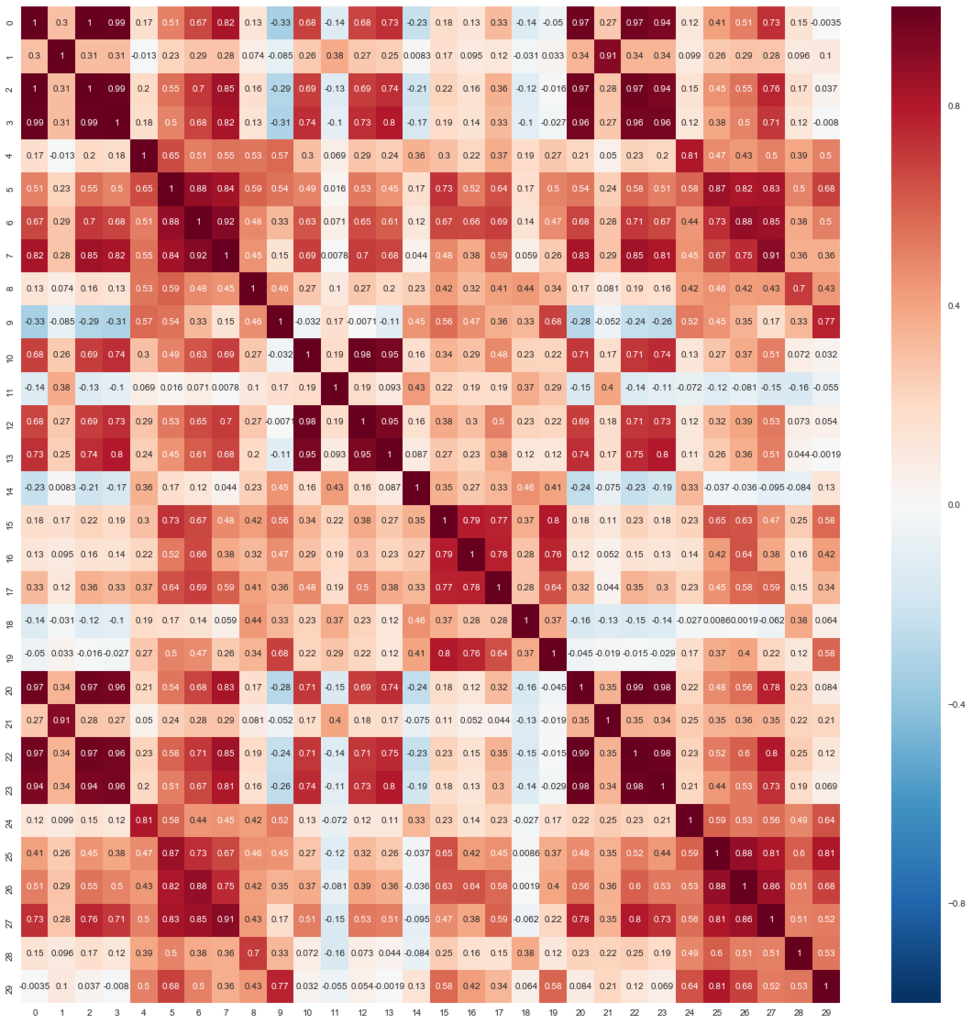
主成分分析する前に、現状の説明変数に相関が高そうか(次元圧縮が有効そうか)について確認します。

plt.figure(figsize=(20, 20))
seaborn.heatmap(pd.DataFrame(X_train_scaled).corr(), annot=True)

黒や赤のマスが幾つかあり、相関が高そうな変数が含まれることが伺えます。 次元圧縮の効果が高そうともいえます。

主成分分析は、サンプルの分散方向に着目して、新しい空間へサンプルを変換するものです。

  1. まず、説明変数空間内でサンプルの分散が最も大きい方向(ベクトル)を発見して、それを新しい軸(第1主成分)とします。
  2. 次に、新しい軸と直交し、かつ、分散が最も大きい方向(ベクトル)を発見して、またそれを新しい軸(第2主成分)とします。
  3. 以上を繰り返すことで、別の軸を持つ空間に、サンプルを配置し直します(射影)。

元々の次元数と同じ次元数まで繰り返すことができますが、次元圧縮する場合は途中で打ち切ります(例えば、第2主成分で打ち切った場合、2次元に圧縮できます)。 主成分分析はサンプルの分散のみに着目しているため、目的変数を必要としません。

scikit-learnではsklearn.decomposition.PCAとして提供されています。

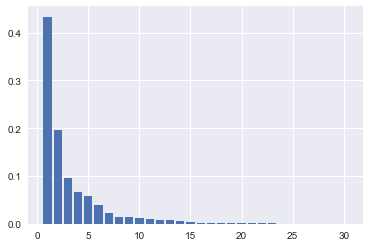
まずは元と同じ次元数(30)にして、主成分分析をしてみて主成分の寄与率を計算します。 寄与率はその主成分の持つ分散度合い(情報量)を表します。

  • 主成分分析後の次元数はn_componentsで指定します
pca = PCA(n_components=30)
pca.fit(X_train_scaled)
plt.bar([n for n in range(1, len(pca.explained_variance_ratio_)+1)], pca.explained_variance_ratio_)

寄与率は、第1主成分で43%、第2主成分で20%、・・・といった値になっており、第4主成分までの累積で80%を超えることがわかります。 主成分分析を次元圧縮に用いる場合、累積寄与率80%の主成分のみを使い、以降の主成分は切り捨てられることが多いようです。

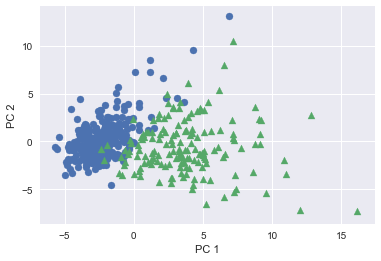
第2主成分まで次元圧縮(30次元→2次元)して、主成分を軸として散布図にプロットしてみます。

# PCA
# 次元数2まで圧縮
pca = PCA(n_components=2)
X_train_pca = pca.fit_transform(X_train_scaled)
print('X_train_pca shape: {}'.format(X_train_pca.shape))
# X_train_pca shape: (426, 2)

# 寄与率
print('explained variance ratio: {}'.format(pca.explained_variance_ratio_))
# explained variance ratio: [ 0.43315126  0.19586506]

# 散布図にプロット
temp = pd.DataFrame(X_train_pca)
temp['Outcome'] = y_train.values
b = temp[temp['Outcome'] == 0]
m = temp[temp['Outcome'] == 1]
plt.scatter(x=b[0], y=b[1], marker='o') # 良性は○でマーク
plt.scatter(x=m[0], y=m[1], marker='^') # 悪性は△でマーク
plt.xlabel('PC 1') # 第1主成分をx軸
plt.ylabel('PC 2') # 第2主成分をy軸

散布図を見ると、左上が良性、右下が悪性といった具合で直線で分離できそうです。

この第2主成分まで次元圧縮した説明変数を使って、学習・テストさせてみます。 標準化・次元圧縮・学習と処理が増えたので、Pipelineでまとめています。

テストデータの精度で94%となり、全ての説明変数を使った場合と比較して約3.5ポイント落としました。 30次元から2次元まで圧縮しましたが、まずまずの精度が得られているのではないでしょうか。

# パイプラインの作成
pca_pipeline = Pipeline([
    ('scale', StandardScaler()),
    ('decomposition', PCA(n_components=2)),
    ('model', LogisticRegressionCV(cv=10, random_state=0))
])

# 標準化・次元圧縮・学習
pca_pipeline.fit(X_train, y_train)

# 検証
print('Train score: {:.3f}'.format(pca_pipeline.score(X_train, y_train)))
print('Test score: {:.3f}'.format(pca_pipeline.score(X_test, y_test)))
print('Confustion matrix:\n{}'.format(confusion_matrix(y_true=y_test, y_pred=pca_pipeline.predict(X_test))))
# Train score: 0.965
# Test score: 0.937
# Confustion matrix:
# [[84  6]
#  [ 3 50]]

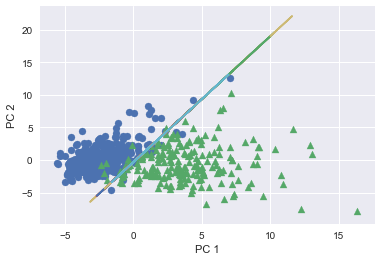
最後に決定境界をプロットしてみると、傾き1.9で切片-0.3の直線が引かれていることがわかります。

# 切片と傾き
intercept = pca_pipeline.steps[2][1].intercept_
coef = pca_pipeline.steps[2][1].coef_
print('model intercept: {}'.format(intercept))
print('model coef : {}'.format(coef))
# model intercept: [-0.30694316]
# model : [[ 1.78050858 -0.92218849]]

# 決定境界をプロット
plt.plot(X_train_scaled, -(X_train_scaled*coef[0][0] + intercept[0])/coef[0][1])
print('y = x*{} + {}'.format(-coef[0][0]/coef[0][1], -intercept[0]/coef[0][1]))
# y = x*1.9307425768880175 + -0.332842107288895

# 散布図にプロット
temp = pd.DataFrame(X_pca)
temp['Outcome'] = y
b = temp[temp['Outcome'] == 0]
m = temp[temp['Outcome'] == 1]
plt.scatter(x=b[0], y=b[1], marker='o')
plt.scatter(x=m[0], y=m[1], marker='^')
plt.xlabel('PC 1')
plt.ylabel('PC 2')

Python scikit-learnのランダムフォレストで受診予約のNo-Showを予測する

Kaggleのデータセットを使って、ランダムフォレストで受診予約のNo-Showを予測します。

データセットのロード

今回はKaggleで公開されているMedical Appointment No Showsを使っていきます。 このデータは、受診予約で1レコードとなっており、患者の情報(年齢・性別やかかっている病気など)や予約どおりに現れたか・現れなかったか、などが15の含まれています。 全体では30万レコードになります。

このデータをcsvとしてダウンロードし、DataFrameに読み込ませます。

# ライブラリのインポート
import pandas as pd
import matplotlib.pyplot as pyplot
% matplotlib inline
from sklearn.model_selection import train_test_split
from sklearn.metrics import confusion_matrix
from sklearn.ensemble import RandomForestClassifier
from sklearn.ensemble import GradientBoostingClassifier
from sklearn.metrics import f1_score
from sklearn.model_selection import GridSearchCV
from sklearn.metrics import make_scorer
import seaborn

# CSVファイルからDataFrameへロード
original_df = pd.read_csv('No-show-Issue-Comma-300k.csv')
original_df.head(6)

以下のデータが含まれています。 typoが目立ちます。

  • 患者の情報
    • 年齢(Age)、性別(Gender) 、ハンディキャップ有無(Handcap)、奨学金有無(Scholarship)
    • アルコール依存(Alcoolism)、喫煙(Smokes)、高血圧(HyperTension)などの、生活習慣に関わる情報
    • 糖尿病(Diabetes)、結核(Tuberculosis)などの、病気に関わる情報
  • 予約の情報
    • 予約登録日時(AppointmentRegistration)、予約日(ApointmentData)、予約日の曜日(DayOfTheWeek)、SMSリマインド?(Sms_Reminder)、予約日と予約登録日までの日数(AwaitingTime)
    • 今回の目的変数となる予約に現れたかどうかの情報はStatusに入っており、現れた場合は'Show-Up'、現れなかった場合は'No-Show'

Show-Upが209,269件、No-Showが90,731件で、概ね7:3の比率です。

original_df['Status'].value_counts()
#Show-Up    209269
#No-Show     90731
#Name: Status, dtype: int64

各データの分布を確認します。 Ageがマイナスになっていたり、2値と思われていたHandcapやSms_Reminderが2以上の値を含んでいたり、若干のデータ不備があるようです。

original_df.hist(figsize=(12, 12))

念のため、月ごとに予約数とNo-Show数に経時的な変化が無いか確認しましたが、特に見られませんでした。

# 経時的な変化は無いか? → 無さそう(12月だけちょっと多いか)
appointments = pd.DataFrame(index=original_df.index)
appointments['AppointmentDate'] = pd.to_datetime(original_df['ApointmentData']).apply(lambda a: '{}/{:02}'.format(a.year, a.month))
appointments['NoShow'] = original_df['Status'].apply(lambda d: 1 if d == 'No-Show' else 0)
temp = pd.DataFrame(appointments.groupby('AppointmentDate').count())
temp['All'] = appointments.groupby('AppointmentDate').count()
temp['NoShow'] = appointments.groupby('AppointmentDate').sum()
temp.reset_index(inplace=True)
plt.plot(temp.index, temp['All'])
plt.plot(temp.index, temp['NoShow'])
plt.show()

f:id:ohke:20170730103451p:plain

目的変数と説明変数の抽出

ロードしたDataFrameから目的変数・説明変数を抽出します。

まずは元データをほとんどそのままコピーして作ります(日時データのAppointmentRegistrationとApointmentDataを除いています)。 Genderの2値化(Mの場合に1とする)、DayOffTheWeekのone-hot-encoding、および、typoの修正も行います。

  • 例えば、DayOffTheWeekがMondayの場合は、AppointmentMondayが1になり、それ以外は0となるように列を分解します(one-hot-encoding)
features_df = pd.DataFrame()

# 目的変数の抽出(No-Showなら1)
features_df['Outcome'] = original_df['Status'].apply(lambda s: 1 if s == 'No-Show' else 0)

# 元データを説明変数に追加(typoも同時に修正する)
features_df['Age'] = original_df['Age']
features_df['Male'] = original_df['Gender'].apply(lambda g: 1 if g == 'M' else 0) # 2値変数化
features_df['Diabetes'] = original_df['Diabetes']
features_df['Alcoholism'] = original_df['Alcoolism']
features_df['HiperTension'] = original_df['HiperTension']
features_df['Handicap'] = original_df['Handcap']
features_df['Scholarship'] = original_df['Scholarship']
features_df['Smokes'] = original_df['Smokes']
features_df['SmsReminder'] = original_df['Sms_Reminder']
features_df['Tuberculosis'] = original_df['Tuberculosis']
features_df['AwaitingTime'] = original_df['AwaitingTime']

# 予約日の曜日をone-hot-encoding
d = pd.get_dummies(original_df['DayOfTheWeek'])
features_df['AppointmentMonday'] = d['Monday']
features_df['AppointmentTuesday'] = d['Tuesday']
features_df['AppointmentWednesday'] = d['Wednesday']
features_df['AppointmentThursday'] = d['Thursday']
features_df['AppointmentFriday'] = d['Friday']
features_df['AppointmentSaturday'] = d['Saturday']
features_df['AppointmentSunday'] = d['Sunday']

各列の相関係数を求めます。

相関係数pandas.DataFrame.corr()で取得できるので、seaborn.heatmap()で可視化します。

  • 最も相関が高いのは年齢(Age)で、年齢が高いほうがNo-Showは少ないようです(負)が、それ以外に有力な説明変数は無さそうです
  • 今回の分析とは関係ないですが、年齢と高血圧・糖尿病、喫煙とアルコール依存症も相関が高いことが伺えます(このあたりは通説と概ねマッチしてますね)
pyplot.figure(figsize=(15,15))
seaborn.heatmap(features_df.corr(), annot=True)

ランダムフォレストでの予測(1回目)

この時点の特徴量を使って、ランダムフォレストで予測させてみます。

ランダムフォレストは、複数の決定木で多数決することで分類する方法です。 各決定木はランダムに復元抽出されたサンプルと、同じくランダムに選択された特徴量を使って学習を行うため、それぞれ異なった決定木となります。

scikit-learnではRandomForestClassifierが提供されており、決定木の個数や各決定木で使う特徴量の個数、各決定木の深さなどを指定できますが、まずはデフォルトで学習・テストさせてみます。 ランダムフォレストでは、データの正規化・標準化を考える必要が無いので、今回のように連続値変数(AgeやAwaitingTime)と2値変数(その他)が混在しているケースでも、簡単に試すことができる利点があります。

結果の分布に偏りがあるため、今回はスコアだけではなく、F値も見ます(No-Showは全体の3割なので、全て0と予測すると、それだけでスコアは0.7になってしまうためです)。 F1値は適合率(あるラベルに分類されたデータの内、正しく分類された検証データの割合)と再現率(あるラベルに分類されるべき検証データの内、そのラベルに分類された割合)の調和平均で、scikit-learnではsklearn.metrics.f1_scoreを使います。

結果を見てみると、学習データではスコア0.80だったのに対して、テストデータでは0.65に留まっており、過学習の傾向があります。 混合行列でも、TP(右下の値、正しくNo-Showと予測した数)が4797で、全体の21%程度しか予測できていません。

# 説明変数と目的変数の分離
X = features_df.ix[:, 'Age':]
y = features_df['Outcome']

# 学習データとテストデータの分離
X_train, X_test, y_train, y_test = train_test_split(X, y, random_state=0)

# ランダムフォレストの作成
forest = RandomForestClassifier(min_samples_leaf=3, random_state=0)
forest.fit(X_train, y_train)

# 評価
print('Train score: {}'.format(forest.score(X_train, y_train)))
print('Test score: {}'.format(forest.score(X_test, y_test)))
print('Confusion matrix:\n{}'.format(confusion_matrix(y_test, forest.predict(X_test))))
print('f1 score: {:.3f}'.format(f1_score(y_test, forest.predict(X_test))))
# Train score: 0.804
# Test score: 0.647
# Confusion matrix:
# [[43714  8633]
#  [17856  4797]]
# f1 score: 0.266

説明変数の追加

以下の仮説に基いて、説明変数を8つ追加してみます。 予約登録した曜日・時間帯に予約登録した人の方が、そうでない人よりもNo-Showは低いだろうという推測に基づいています。

  • 予約登録した曜日(RegistrationMonday〜RegistrationSunday, 7変数)
    • 予約登録した曜日が1(それ以外は0)
  • 予約登録した時間帯(RegistrationWorktime)
    • 営業時間帯(9時-17時と仮定)に予約登録していると1(それ以外は0)
regs = pd.to_datetime(original_df['AppointmentRegistration'])
features_df['RegistrationMonday'] = regs.apply(lambda r: 1 if r.date().weekday() == 0 else 0)
features_df['RegistrationTuesday'] = regs.apply(lambda r: 1 if r.date().weekday() == 1 else 0)
features_df['RegistrationWednesday'] = regs.apply(lambda r: 1 if r.date().weekday() == 2 else 0)
features_df['RegistrationThursday'] = regs.apply(lambda r: 1 if r.date().weekday() == 3 else 0)
features_df['RegistrationFriday'] = regs.apply(lambda r: 1 if r.date().weekday() == 4 else 0)
features_df['RegistrationSaturday'] = regs.apply(lambda r: 1 if r.date().weekday() == 5 else 0)
features_df['RegistrationSunday'] = regs.apply(lambda r: 1 if r.date().weekday() == 6 else 0)

features_df['RegistrationWorktime'] = regs.apply(lambda r: 1 if r.hour >= 9 and r.hour < 17 else 0)

もう一度、相関係数を表示させてみます。 追加した変数も決定的とは言えなさそうです。

重要度の測定と説明変数の削減

再度、randomForestClassifierで学習・テストさせてみますと、全体的に若干の改善が見られます。

X = features_df.ix[:, 'Age':]
y = features_df['Outcome']

X_train, X_test, y_train, y_test = train_test_split(X, y, random_state=0)

forest = RandomForestClassifier(random_state=0)
forest.fit(X_train, y_train)
print('Train score: {:.3f}'.format(forest.score(X_train, y_train)))
print('Test score: {:.3f}'.format(forest.score(X_test, y_test)))
print('Confusion matrix:\n{}'.format(confusion_matrix(y_test, forest.predict(X_test))))
print('f1 score: {:.3f}'.format(f1_score(y_test, forest.predict(X_test))))
# Train score: 0.829
# Test score: 0.641
# Confusion matrix:
# [[42923  9424]
#  [17528  5125]]
# f1 score: 0.276

RandomForestClassifierは、feature_importances_というプロパティを持っており、各説明変数の重要度を持っています。 棒グラフで可視化してみると重要度が高い方からAge、AwaitingTime、Male、・・・と順に続いています。

values, names = zip(*sorted(zip(forest.feature_importances_, X.columns)))

pyplot.figure(figsize=(12,12))
pyplot.barh(range(len(names)), values, align='center')
pyplot.yticks(range(len(names)), names)

下5つの変数についてはほぼ影響を与えないようなので、削除します。

features_df.drop(['RegistrationSunday', 'AppointmentSunday', 'Tuberculosis', 'RegistrationSaturday', 'AppointmentSaturday'], axis=1, inplace=True)

ハイパーパラメータの探索

最後にグリッドサーチでハイパーパラメータを探索します。

  • n_estimators: 決定木の数(デフォルトは10)を設定しますが、基本的に多ければ多いほど良くなる(=計算時間とのトレードオフ)なので、今回は10に固定します
  • max_features: 各決定木で分類に使用する説明変数の数で、今回は4パターン(1, ‘auto’=全ての説明変数の数の2乗根、None=全ての説明変数の数と同じ)にします
  • max_depth: 各決定木の深さを表し、深ければ深いほど複雑な分岐になります(=過学習を起こしやすい)
  • min_samples_leaf: 決定木の葉に分類されるサンプル数を決めるパラメータで、3パターン(1, 2, 4)で試します

今回は、スコア方法をF1にします。 GridSearchCVのscoringオプションで変更できます。 またcv=4として、4グループずつに分けて交差検証します。

# ハイパーパラメータ
forest_grid_param = {
    'n_estimators': [100],
    'max_features': [1, 'auto', None],
    'max_depth': [1, 5, 10, None],
    'min_samples_leaf': [1, 2, 4,]
}

# スコア方法をF1に設定
f1_scoring = make_scorer(f1_score,  pos_label=1)

# グリッドサーチで学習
forest_grid_search = GridSearchCV(RandomForestClassifier(random_state=0, n_jobs=-1), forest_grid_param, scoring=f1_scoring, cv=4)
forest_grid_search.fit(X_train, y_train)

# 結果
print('Best parameters: {}'.format(forest_grid_search.best_params_))
print('Best score: {:.3f}'.format(forest_grid_search.best_score_))
# Best parameters: {'max_depth': None, 'max_features': 1, 'min_samples_leaf': 1, 'n_estimators': 10}
# Best score: 0.276

得られたベストパラメータで学習・テストさせてみましたが、デフォルトとほぼ変わらない結果となりました。 これ以上の精度を目指すなら、説明変数を増やす必要があるかもしれません。

X = features_df.ix[:, 'Age':]
y = features_df['Outcome']

X_train, X_test, y_train, y_test = train_test_split(X, y, random_state=0)

best_params = forest_grid_search.best_params_

forest = RandomForestClassifier(random_state=0, n_jobs=-1, 
                                max_depth=best_params['max_depth'], 
                                max_features=best_params['max_features'], 
                                min_samples_leaf=best_params['min_samples_leaf'],
                                n_estimators=best_params['n_estimators'])
forest.fit(X_train, y_train)
print('Train score: {:.3f}'.format(forest.score(X_train, y_train)))
print('Test score: {:.3f}'.format(forest.score(X_test, y_test)))
print('Confusion matrix:\n{}'.format(confusion_matrix(y_test, forest.predict(X_test))))
print('f1 score: {:.3f}'.format(f1_score(y_test, forest.predict(X_test))))
# Train score: 0.828
# Test score: 0.638
# Confusion matrix:
# [[42551  9796]
#  [17368  5285]]
# f1 score: 0.280